The Victorian Department of Transport & Planning maintain a very useful dashboard that compiles data from most of the permanent bicycle counters in Melbourne. If you haven’t seen it before it’s available on this page under ‘Bicycle Speeds and Volumes’.
In the years since the end of the COVID-19 lockdowns there was a noticeable dip in the number of bikes recorded. I haven’t seen any empirical research on this but my opinion is that this was a combination of two things. Firstly, reduced peak trips due to the increase in the number of jobs that are fully or partly worked from home, and secondly a reduction in recreational trips from the high point reached during the 2020 – 2021 years.
The trend since the lockdowns was somewhat worrying. For example, the total number of trips for 2022 was the lowest since at least 2015 with just under 9 million bikes recorded.
But I am now very pleased to say that 2024 is shaping up to be a much better year. While we are obviously still in October we are on track to record the highest number of bikes since at least the lockdowns.
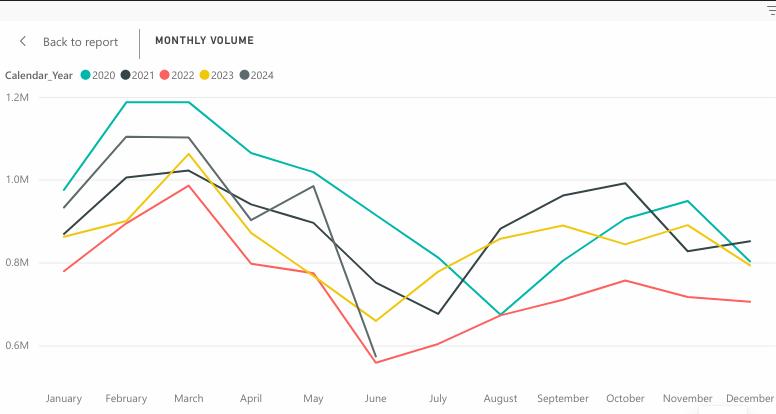
There are some caveats to this information.
For one, there has been a small increase in the number of counters included in this dashboard. By definition, this will result in more bikes being recorded. But even accounting for this 2024 is looking good. Also for some reason data beyond mid-June is not loaded into the dashboard yet but early indications are promising.
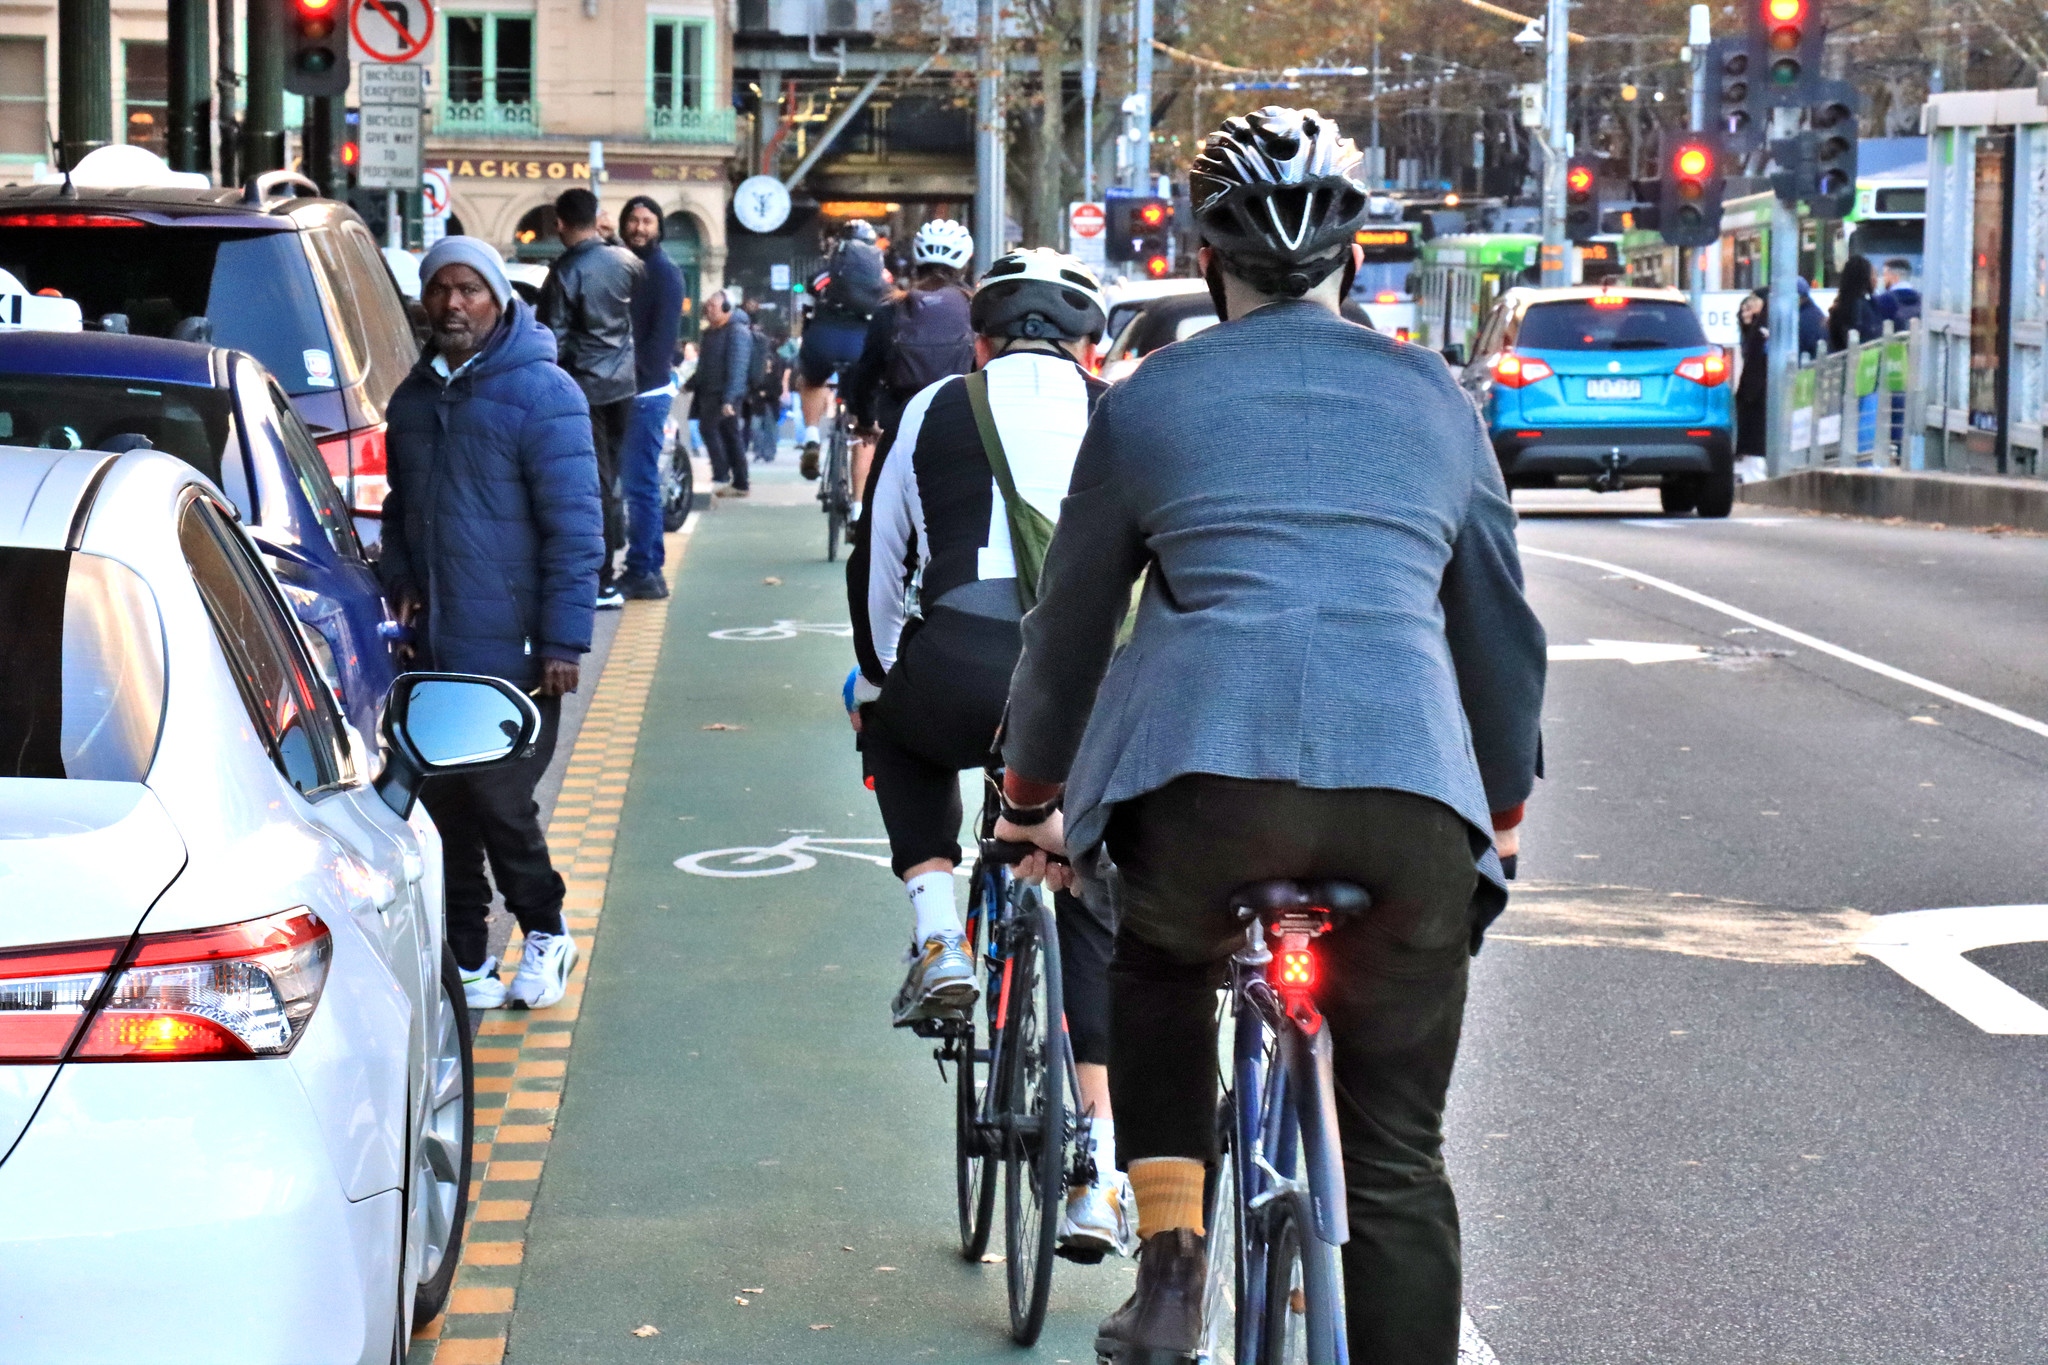
At least part of this increase is due to infrastructure improvements. Most notably the long-delayed new protected bike lanes on St Kilda Road.
The graph below shows the huge increase in the number of people riding bikes at this counter, which is located on St Kilda Road near Anzac Avenue.
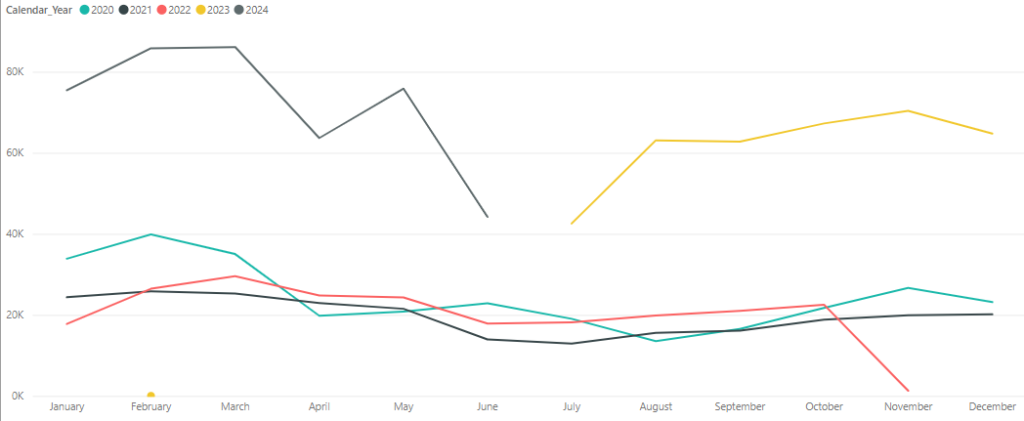
It shows that the number of people riding on St Kilda Road has more than doubled. By way of example, the number of people riding here in January jumped from 33,868 to 75,434 between 2020 and 2024. This is even with all the disruptions caused by Metro Tunnel works so I would expect this to increase even further once that is all done. It goes to show how effective just one relatively small piece of infrastructure can be.
Another point to note for this and future data is the impact of West Gate Tunnel works on the four bicycle counters located to the west of the CBD. These are shown on the map below.
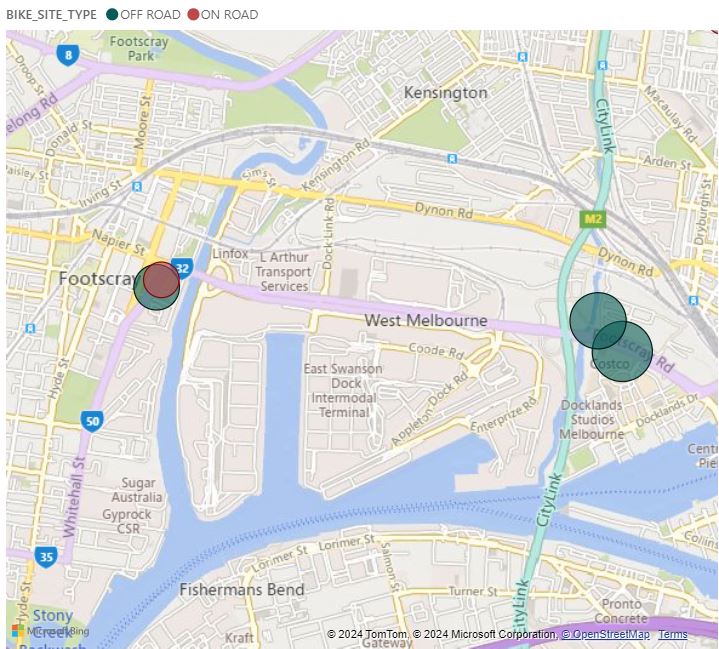
There have already been significant disruptions, path closures and crashes resulting in people being killed or seriously injured during this time. Despite all this the numbers here are not as low as I thought they might, although this may change over time as the disruptions continue.
The graph below shows combined figures from the four counters above.

One final thing to note is something that looks like bad news but isn’t.
The northernmost counter in metropolitan Melbourne on St Georges Road just next to Bell Street has recorded a significant fall for 2023 and 2024, as seen in the graph below.
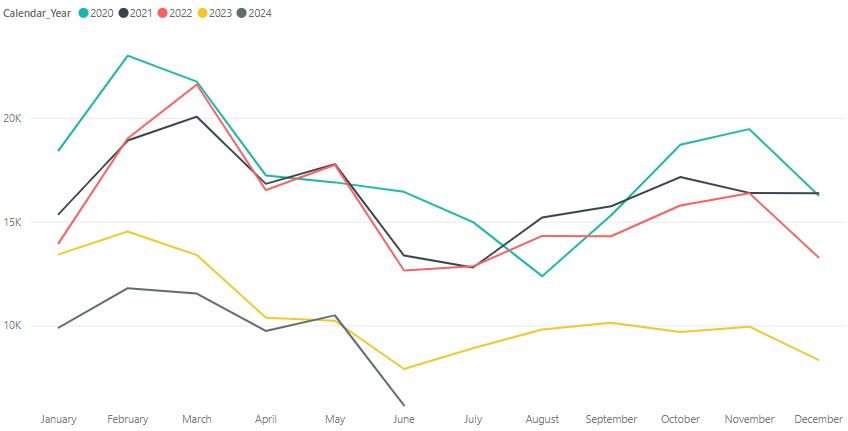
What has almost certainly caused this sudden decline is the opening of a new shared path just east of here as part of the Preston – Bell Level Crossing Removal Project.
This changed what was a pretty scrappy path into a much more attractive walking and cycling route. The new shared path avoids several hairy intersections, runs closer to places where people want to go, and avoids riding down the middle of a 70km/h high traffic urban highway.
This is a perfect example of why you need context from other sources to read and interpret data. On its own this looks like a catastrophic decline in the number of people cycling in Preston. But as we’ve just seen this is not in fact the case.
Overall I’m quite optimistic for where the data seems to be heading, which is to take us back to at least pre-COVID lockdown levels.
As usual it’s important to bear in mind that these counters do not record every trip made by bike in Melbourne and most journeys that people make are not included. But they do play an important role for understanding when and how people are riding bikes across the city.

Leave a Reply