

I recently posted about the updated data that has been released for metropolitan and regional station usage in Melbourne and Victoria.
From this new information we can look at which stations were the most used and least used during the 2023 – 2024 financial year.
Most used stations in Melbourne
For the metropolitan network these were the ten busiest stations.
| Station | 2023-24 patronage | Rank | Rank in 2022-23 | Rank in 2018-19 |
|---|---|---|---|---|
| Flinders Street | 20,345,200 | 1 | 1 | 1 |
| Southern Cross | 14,019,450 | 2 | 2 | 2 |
| Melbourne Central | 8,626,300 | 3 | 3 | 3 |
| Parliament | 5,862,900 | 4 | 4 | 4 |
| Footscray | 4,365,800 | 5 | 5 | 5 |
| Richmond | 3,722,400 | 6 | 6 | 8 |
| Flagstaff | 3,435,300 | 7 | 8 | 6 |
| South Yarra | 3,100,250 | 8 | 7 | 7 |
| Caulfield | 2,909,850 | 9 | 9 | 9 |
| Box Hill | 2,535,00 | 10 | 10 | 10 |
I have excluded Union Station from any analysis as this was its first full year of data and is not a fair comparison. Also note as always that Caulfield overestimates patronage due to the design of the fare gates that force people interchanging to touch on and off when changing platforms.
There has not been any change to the stations in the top ten for as long as I have data. There have been some slight changes in the order; most notably the increase in usage at Richmond pushing Flagstaff and South Yarra a little down. This may have been due to increased needs for people to change since the removal of the Frankston and Werribee / Williamstown Lines from the City Loop and several long-term disruptions to the City Loop over the past couple of years.
Otherwise no real surprises here.
Most used regional stations in Victoria
For the regional rail network these were the ten busiest stations.
| Station | 2023-24 patronage | Rank | Rank in 2022-23 | Rank in 2018-29 |
|---|---|---|---|---|
| Southern Cross | 5,925,200 | 1 | 1 | 1 |
| Tarneit | 1,495,450 | 2 | 2 | 2 |
| Geelong | 969,600 | 3 | 4 | 3 |
| Wyndham Vale | 919,500 | 4 | 3 | 5 |
| Melton | 761,300 | 5 | 5 | 4 |
| Ballarat | 604,350 | 6 | 6 | 6 |
| Deer Park | 518,750 | 7 | 7 | 8 |
| Bendigo | 456,400 | 8 | 8 | 9 |
| Bacchus Marsh | 334,450 | 9 | 10 | 11 |
| Rockbank | 328,050 | 10 | 13 | 43 |
The big story here is the astronomical rise of Rockbank Station from 43rd place in 2018-19 to 10th in 2023-24. This is due to the huge amount of suburban development that has happened nearby.
To give you an idea of the scale of change this is Rockbank in 2015 compared to 2023.
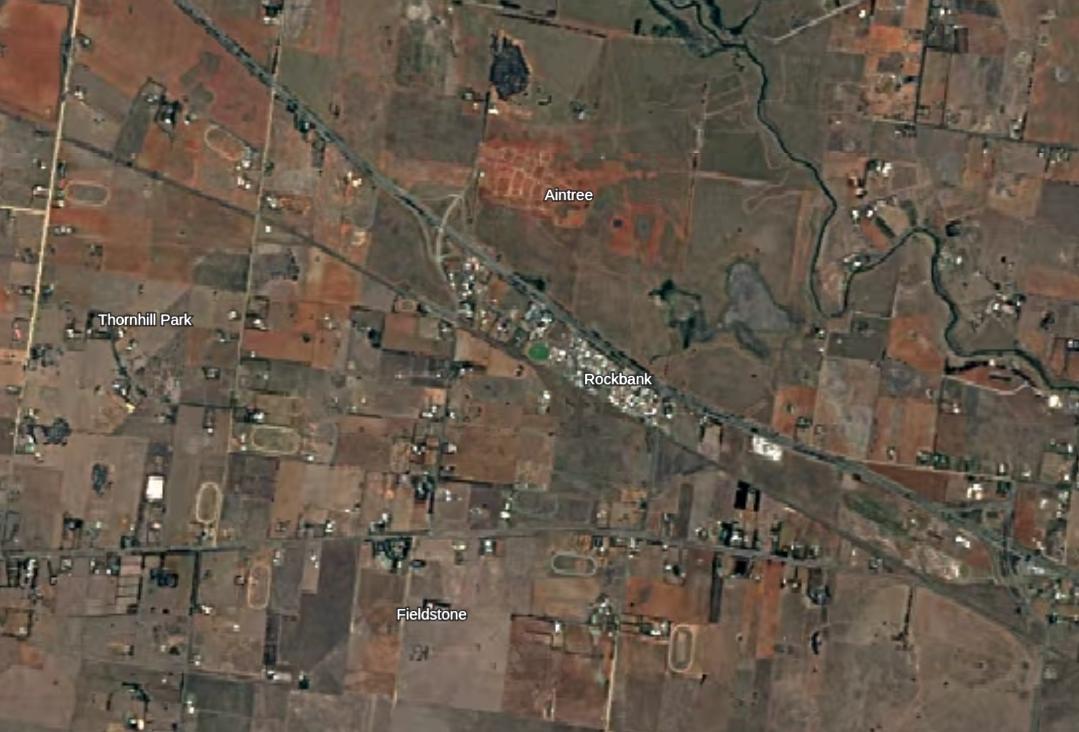

Wyndham Vale is a similar story although much of it was already developed in 2018-19 so there is less of a change in these comparison years. It will also be interesting to see how the patronage of Rockbank is affected – if at all – by new stations opening up nearby like Cobblebank.
As for Tarneit, it has held its place as the second busiest V/Line station in Victoria ever since it opened. In its first full year of patronage statistics (2015-16) it recorded 713,250 passengers. It now has nearly double that just eight years later.
Least used stations in Melbourne
For the metropolitan network these were the ten least used stations.
| Station | 2023-24 patronage | Rank | Rank in 2022-23 |
|---|---|---|---|
| Baxter | 2,550 | 1 | 1 |
| Tyabb | 3,250 | 2 | 2 |
| Morradoo | 3,600 | 3 | 3 |
| Leawarra | 5,150 | 4 | 5 |
| Stony Point | 6,700 | 5 | 4 |
| Crib Point | 7,150 | 6 | 8 |
| Somerville | 7,400 | 7 | 7 |
| Bittern | 7,850 | 8 | 6 |
| Hastings | 14,300 | 9 | 9 |
| Wattle Glen | 30,100 | 10 | 10 |
For the electrified metropolitan network (i.e. excluding the Stony Point Line) these were the ten least used stations.
| Station | 2023-24 patronage | Rank | Rank in 2022-23 |
|---|---|---|---|
| Wattle Glen | 30,100 | 1 | 1 |
| Tecoma | 43,350 | 2 | 2 |
| Willison | 75,100 | 3 | 3 |
| Hurstbridge | 82,350 | 4 | 4 |
| Seaholme | 86,500 | 5 | 6 |
| Alamein | 91,500 | 6 | 5 |
| Upwey | 92,050 | 7 | 7 |
| Darebin | 102,800 | 8 | 8 |
| Eaglemont | 111,200 | 9 | 9 |
| Rushall | 119,850 | 10 | 11 |
I have excluded East Pakenham, Mont Albert, Surrey Hills and Union from both lists as they did not have a full year of operation in 2022-23, and Parkdale that was in a similar situation for 2023-24.
Nothing really out the ordinary here. There are some small shifts in positions but these rankings have remained more or less unchanged since 2008.
The main exceptions are these stations that have seen quite significant patronage increases and are well out of the least used station rankings:
- Officer (least used station in 2008, now 36th least used)
- Jacana
- Macaulay
- Flemington Bridge
- Middle Footscray
These all appear to relate to an increase in the number of people living near these stations, except Macaulay which jumped significantly between 2013-14 and 2015-16. I’m not sure why.
Least used stations in Victoria
For the V/Line network these were the ten least used stations.
| Station | 2023-24 patronage | Rank | Rank in 2022-23 |
|---|---|---|---|
| Dingee | 350 | 1 | 2 |
| Talbot | 850 | 2 | 4 |
| Raywood | 850 | 3 | 3 |
| Huntly | 1,000 | 4 | 1 |
| Creswick | 1,300 | 5 | 5 |
| Avenel | 1,400 | 6 | 8 |
| Clunes | 1,850 | 7 | 10 |
| Elmore | 1,900 | 8 | 6 |
| Goornong | 2,150 | 9 | 7 |
| Rosedale | 2,550 | 10 | 11 |
The general trend here is that the several new stations built in growth areas of regional centres are starting from a low base but starting to see patronage increases.
For example, Huntly’s first full year of patronage (2022-23) it recorded only 250 passengers and was the least used station. In this second year that has quadrupled to 1,000.
These new stations have knocked Elmore off its previous multi-year position as the least used station in Victoria. The other reason is that Elmore has seen an increase in patronage. In 2016-17 it only had 884 people, by this year it has gone up by 115% to 1,900. This may be related to the various infrastructure improvements on the Echuca Line that have made passenger rail travel more attractive.
As always there are important notes and context on these data. You can see these in the first tab of the spreadsheets for metropolitan and regional patronage here and here respectively.
Leave a Reply