Tag: Data

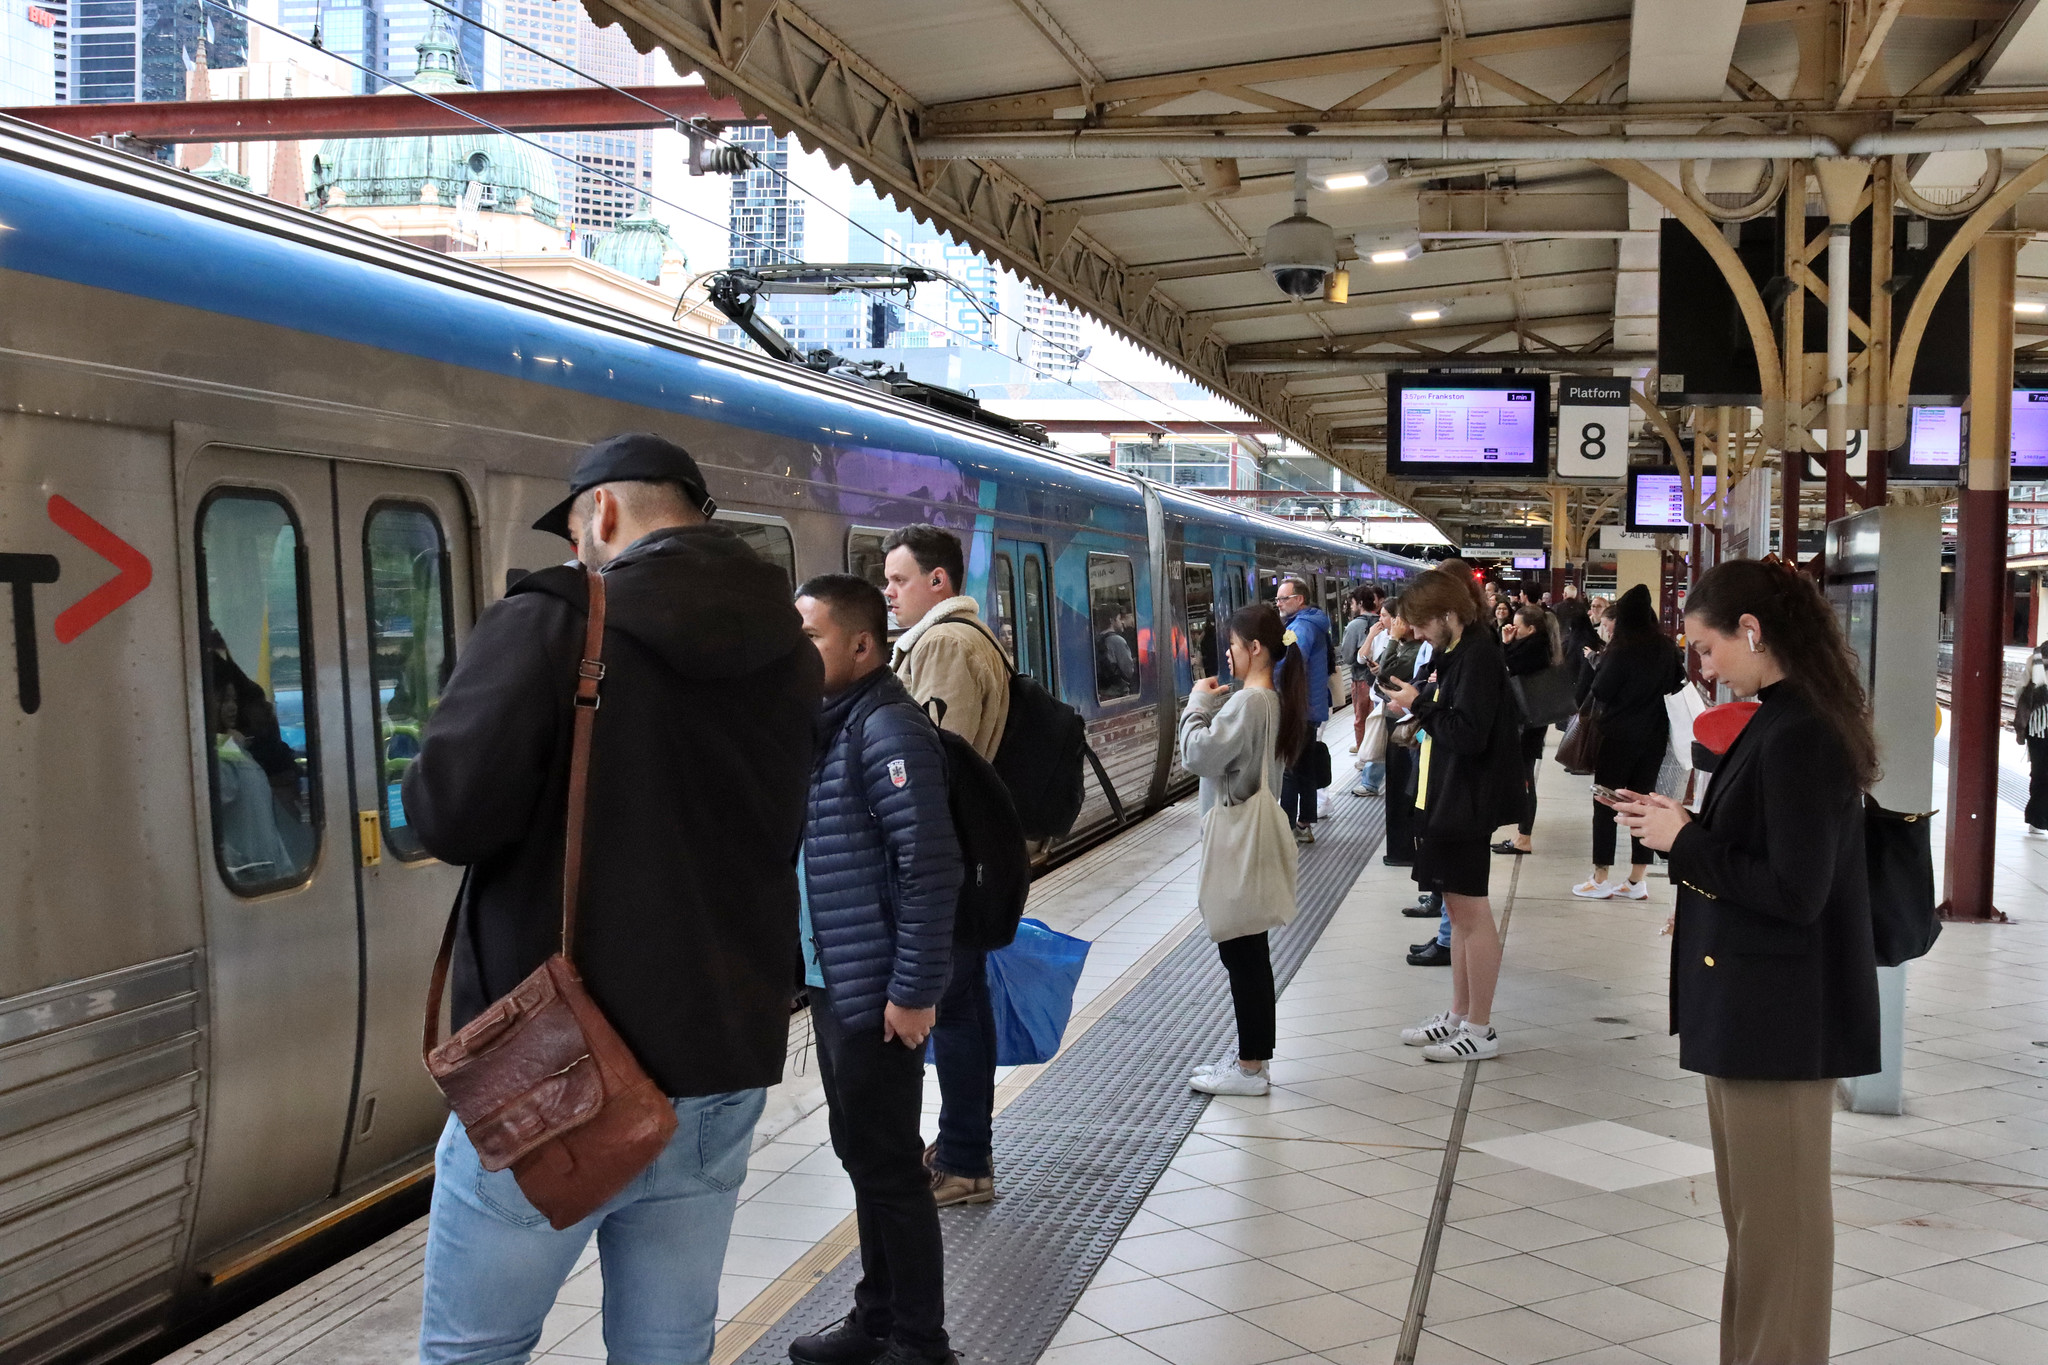
Which were the least and most used stations in Victoria in 2024-25?
I recently posted about the updated data that has been released for metropolitan and regional station usage in Melbourne and Victoria. From this new information we can look at which stations were the most used and least used during the 2024 – 2025 financial year. Most used stations in Melbourne For the metropolitan network these…

Railway station patronage for Melbourne and Victoria 2008 – 2025
Here is another yearly update on metropolitan and regional railway station patronage, this time adding the recently-released 2024/25 Financial Year data. Since 2019 I’ve been keeping abreast of patronage for the train and tram network in Victoria. I’ve been progressively adding to the two spreadsheets I keep for this purpose. Not only to allow comparison…

Which were the least and most used stations in Victoria in 2023-24?
I recently posted about the updated data that has been released for metropolitan and regional station usage in Melbourne and Victoria. From this new information we can look at which stations were the most used and least used during the 2023 – 2024 financial year. Most used stations in Melbourne For the metropolitan network these…
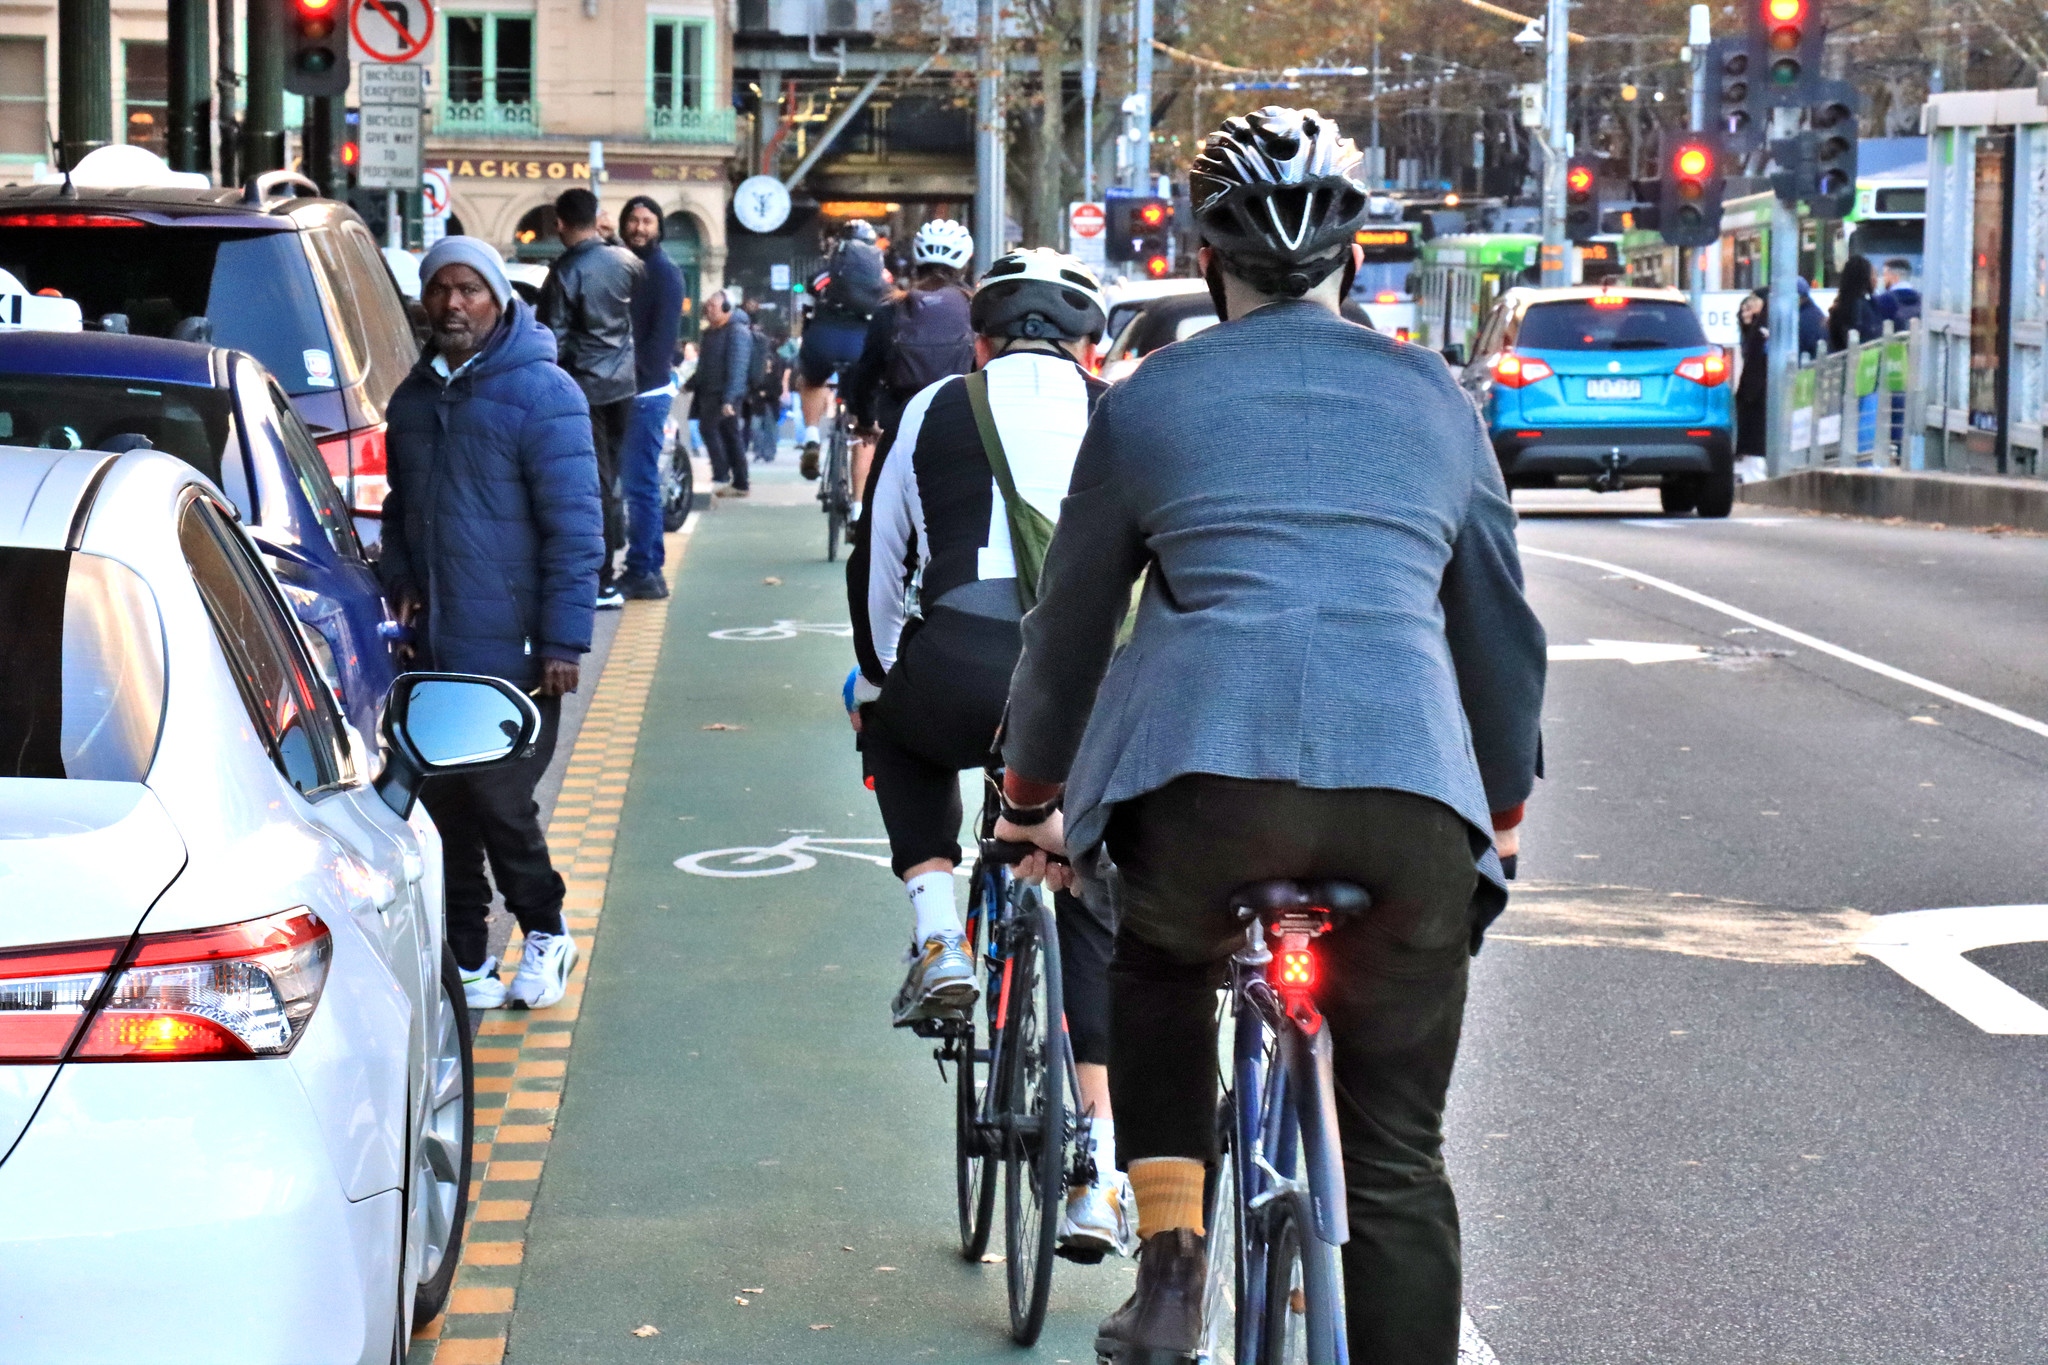
Something good is happening to Melbourne’s cycling levels
The Victorian Department of Transport & Planning maintain a very useful dashboard that compiles data from most of the permanent bicycle counters in Melbourne. If you haven’t seen it before it’s available on this page under ‘Bicycle Speeds and Volumes’. In the years since the end of the COVID-19 lockdowns there was a noticeable dip…
Railway station patronage for Melbourne and Victoria 2008 – 2024
Since 2019 I’ve been keeping abreast of patronage data for the train and tram network in Victoria. While previously I have had to lodge specific requests I am pleased to report that the open data situation has improved significantly. Most of this information is now publicly available on the data.vic.gov.au portal. With the release of…

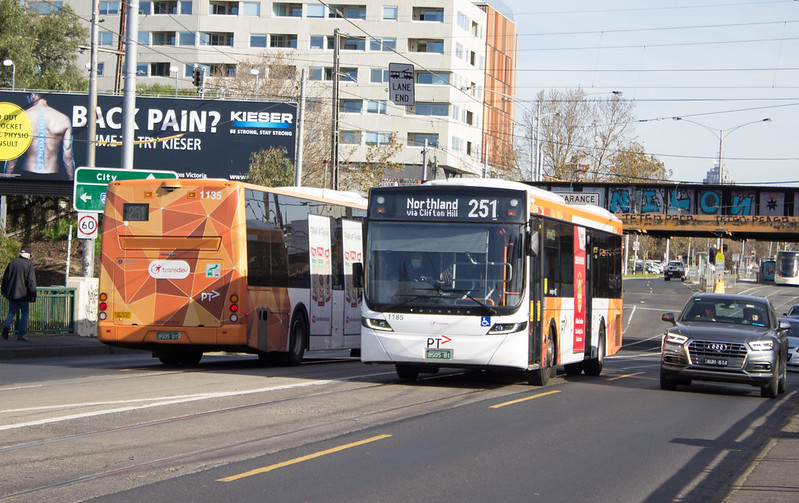
The most and least punctual bus routes in Melbourne
See the data here. On Friday last week, the Department of Transport added metropolitan bus performance data to its monthly public transport reporting. This is exciting news as it was not previously publicly available. The data is not very easy to find. To get there, you have to visit ptv.vic.gov.au, scroll to the bottom of…
Impact of COVID-19 lockdown on cycling in Melbourne – a first glance
Anyone who has been out on Melbourne’s street network or shared paths will have witnessed the explosion in the number of people walking and cycling. Until now, this increase has been purely anecdotal. The other day I had a brief look at the bicycle volume and speed data from the Victorian Government data portal, just…
Melbourne bus patronage data 2008 – 2017
Download the data here. Update 8 April 2019: Peter Parker over at Melbourne On Transit has kindly added extensive notes to the spreadsheet (which has now been updated). Last year I requested bus route patronage data from Public Transport Victoria. They obliged quickly (no FOI request needed) but I totally forgot to publish the information.…
Which station in Melbourne has the fastest-growing patronage?
This post continues a series analysing station patronage data for Melbourne and Victoria from 2013 to 2018. This time, we are going to look at patronage growth across the metropolitan area. Result Combined with the data already available on the TfV website from 2008, we now have a nine year view of station patronage in…
Which are the least and most used stations in Victoria?
As mentioned in a previous post, I recently acquired station patronage data for Melbourne and Victoria for 2013 to 2018. This means that we can now play with the data! One of the first questions that comes up when looking at station usage data is which stations are have the highest and lowest numbers of…